Both ‘htop’ and ‘top’ are powerful and interactive tools for monitoring system processes and resource usage on a Linux cluster.
htop
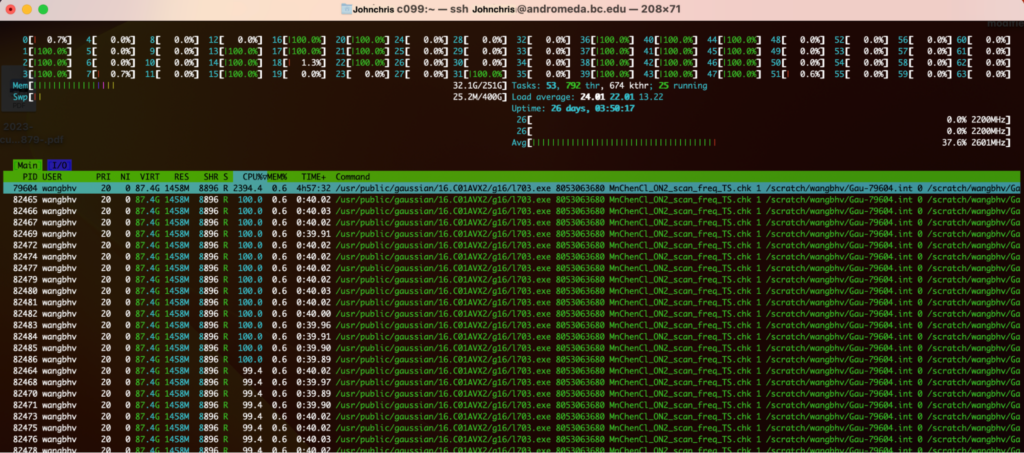
‘htop’ provides rich visual information (processor, swap, mem, etc.) with a colored display. To perform an action on a process, navigate to the process using the arrow keys and click the following function keys. Users can set the tree view by pressing F2 in the ‘set up’ menu.
In the screenshot below, above the green row, there is a graph of CPU usage for all CPUs on the compute node of c099. Currently, 36 CPUs are idle, 24 CPUs are being 100% used and only 4 CPUs (#0, #7,#18 and #51) are partially utilized. Below the green row, it displays a user job running Gaussian (g16). We monitor the RES, CPU%, and MEM% usage. The RES (RAM) is 1458M, MEM% is 0.6, but the CPU% is 99.4% and %100
If the job is using 100% memory, the user should request slightly more memory. Otherwise, Slurm might kill the job due to this. In fact, it needs (applied) more memory than the Slurm script file asked for. Also, if a user’s job is using 100% CPU, the user needs to resubmit with more CPUs to speed up job performance.
Note that the RES, CPU%, and MEM% columns dynamically change depending on what Gaussian calculation is doing. For more details, please refer to link below https://gridpane.com/kb/how-to-use-the-htop-command-to-monitor-system-processes-and-resource-usage/